People Analytics is a tool which contributes to the simplification, centralization and expansion of the reporting and analysis capabilities within SAP SuccessFactors.
Managing based on data is becoming increasingly important. Organizations want to be able to present well-founded Key Performance Indicators (KPI) and useful insights from analysis to management, so that strategic choices can be made.
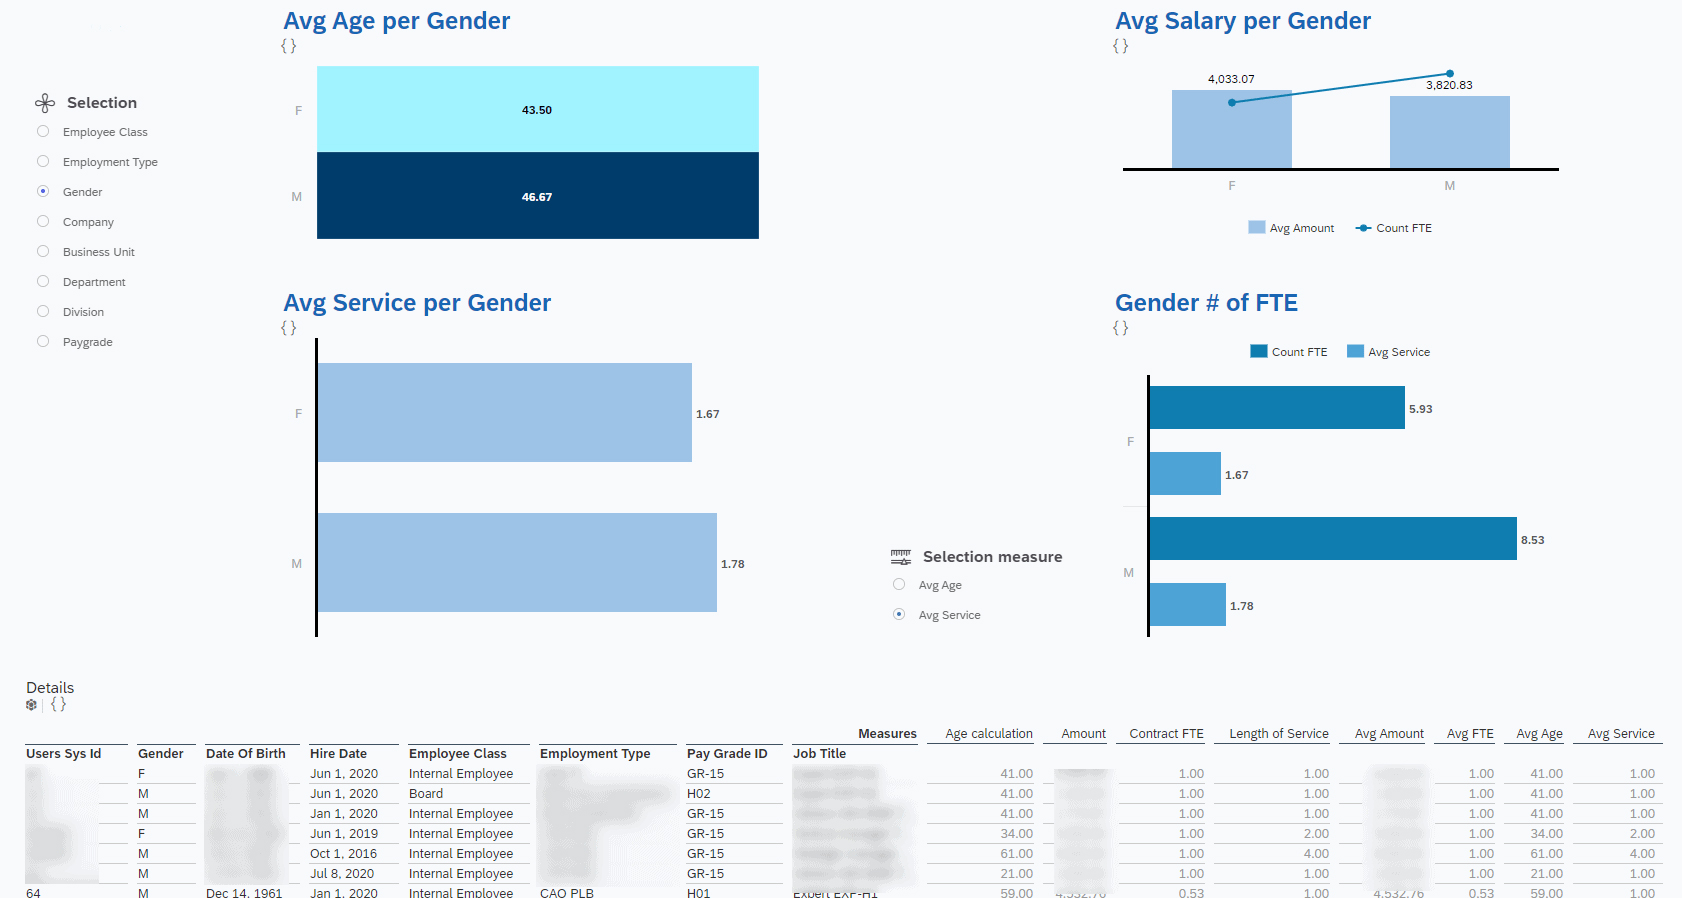
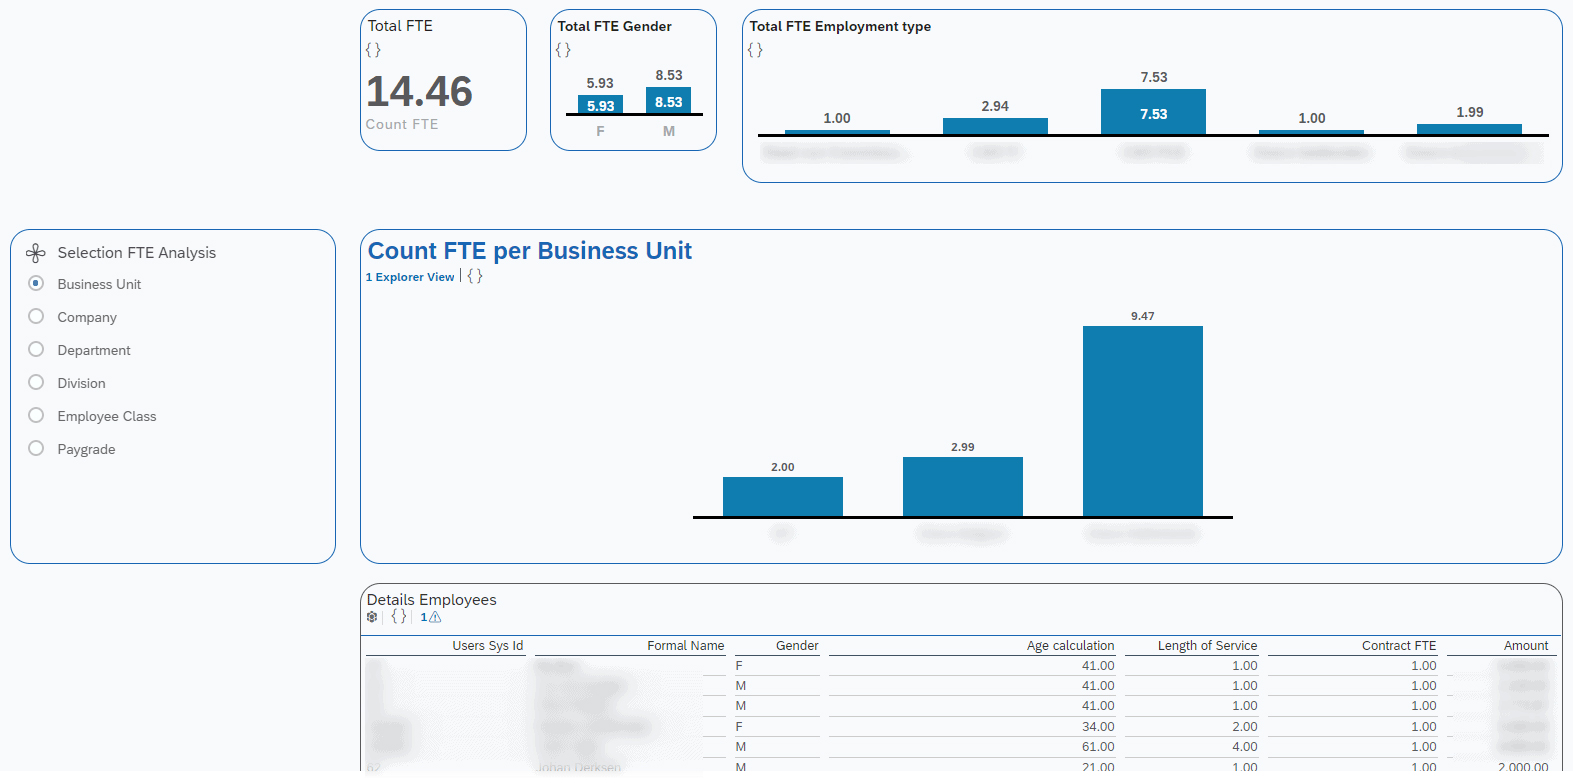
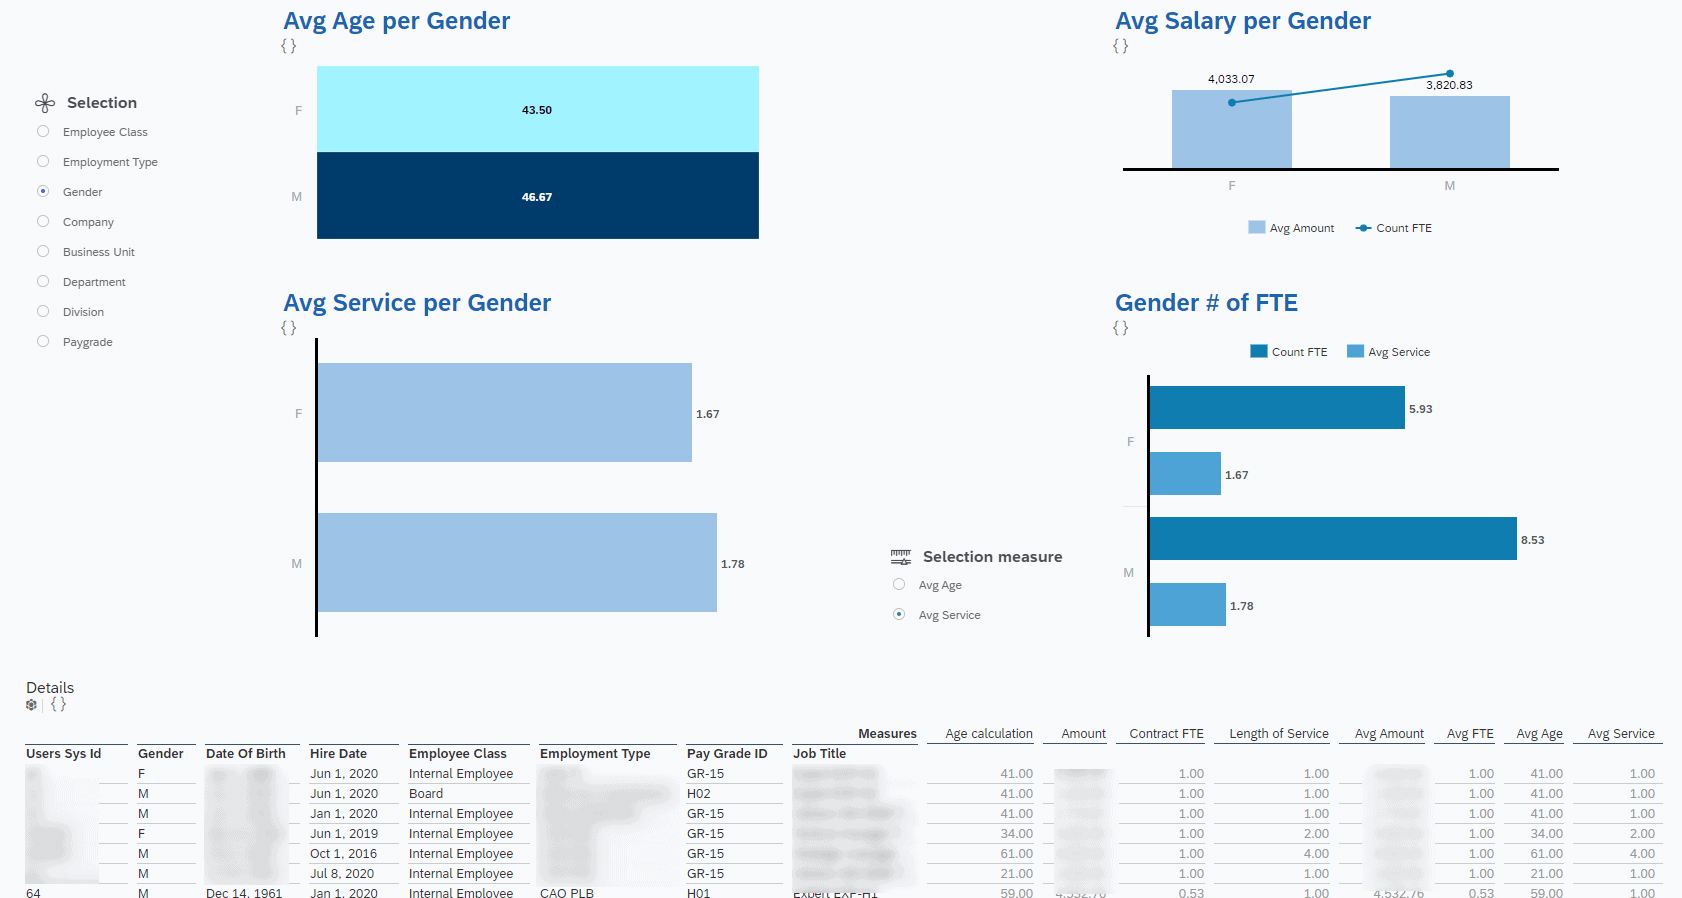
The functionality Stories within People Analytics brings data to life by visually stunning presenting the organizational data. It’s also possible within People Analytics to create cross-suite reports, based on realtime transactional data within the SAP SuccessFactors HXM Suite. Information from for example Recruiting and Onboarding can be combined.
Changes in the landscape
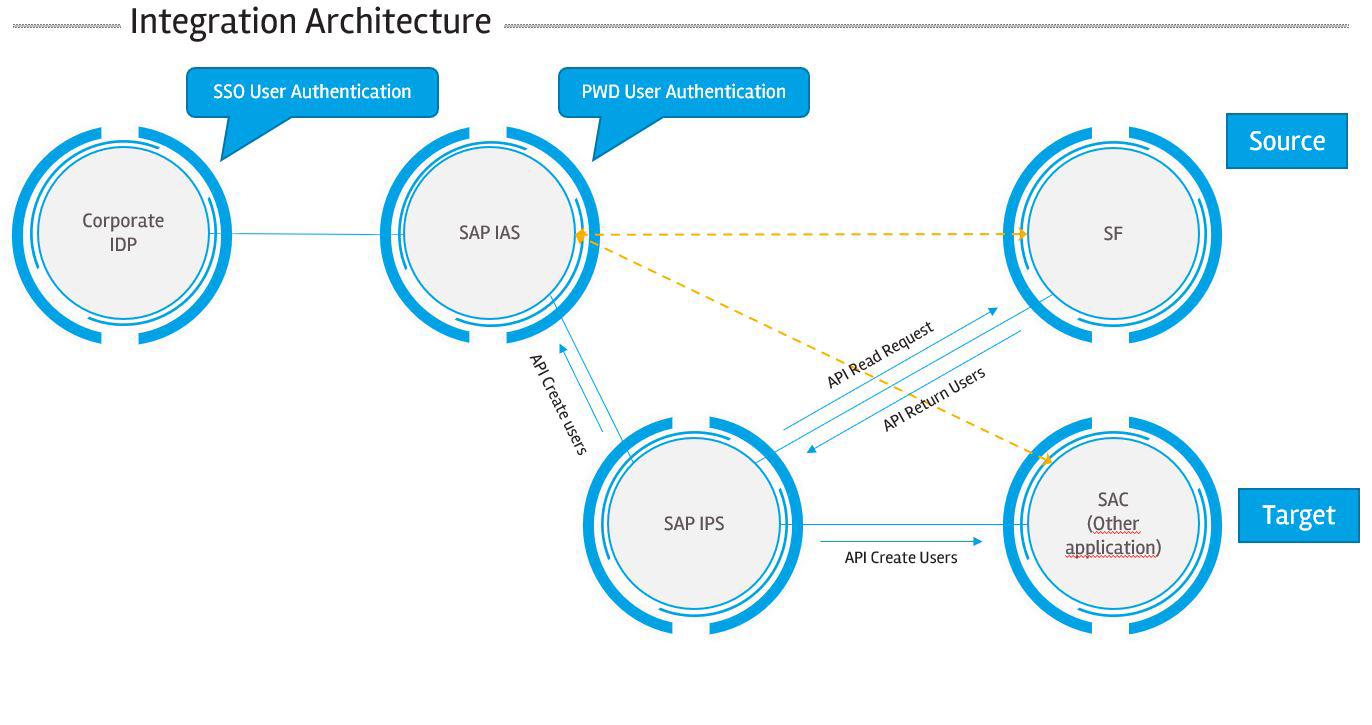
The arrival of People Analytics has led to changes within the application landscape of SuccessFactors. People Analytics, a product of SAP Analytics Cloud, is embedded within SuccessFactors. By using a Single Sign-On connection it’s possible to combine the best of two worlds, the data from SuccessFactors and the reporting power of SAP Analytics Cloud. For this process to function optimally, three different tenants are created during the implementation of People Analytics. This is done through an upgrade in the Upgrade Center. The so-called IAS and IPS tenant, which stands for Identity Authentication Services and Identity Provisioning Services, and the SAP Analytics Cloud tenant.
SAP aims to use the IAS as the central Identity Provider. This to create one central location for logging into all SAP Cloud applications, including SuccessFactors. The current login page of SuccessFactors will therefore be discontinued. IAS has more to offer for topics such as login, security and self-service. If an organization has its own Identity Provider, users can log in to the IAS by means of (Partial) Single Sign-On, in order to access the various SAP Cloud applications.
To provide the IAS of users, the IPS is required. The IPS synchronizes users from a source system such as SuccessFactors to a target system. As People Analytics is embedded within SuccessFactors, it’s necessary to create the users from SuccessFactors not only in the IAS, but also in SAP Analytics Cloud. In the IAS so that users can log in to the various applications and in SAP Analytics Cloud so that users can use the functionality of People Analytics.
Fortunately, SuccessFactors provides a simple step-by-step plan to implement the aforementioned landscape smoothly onto your own environment.
Story Reports
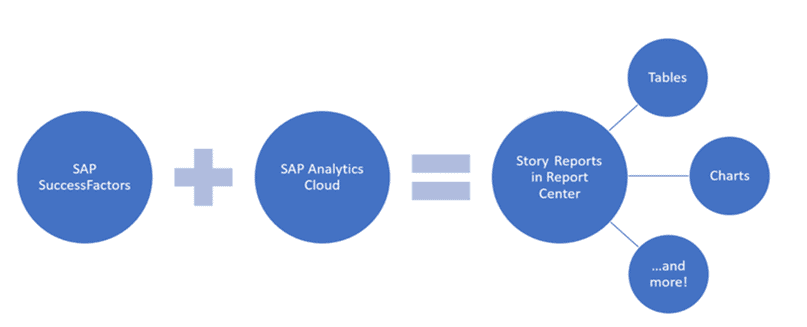
After the implementation of People Analytics is completed, a new report type will become available in the Report Center: “Story”. Story in Report Center is part of the People Analytics solution and s based on the integration of the SAP SuccessFactors HXM Suite with SAP Analytics Cloud. After creating a story, it’s possible to create different pages, add sections and use various elements such as images, icons and charts. Stories can be shared with other users.
Query
To create a Story Report, first a query must be composed. A query is the dataset with which the report will be designed. The data which can be selected can come from the entire SuccessFactors Suite, including custom MDF objects. The tooling allows for the creation of multiple queries for one story. This way, it’s possible to run cross-suite reports. With the Calculated Columns function it’s also possible to display data which cannot be explicitly within SuccessFactors, but which can be derived from multiple existing records. Examples are the age of the employee based on the data of birth or the calculation of the years of service.
Canvas
After the correct dataset has been specified, it’s important to visualize the information and provide the canvas with interactive insights. People Analytics has various available elements for this. Elements such as graphs, tables, images, shapes, texts, but also a clock or even web pages can be added to the canvas. People Analytics also offers the possibility to connect different graphs. This ensures that het moment a filter is applied within a graph, it also affects the other (connected) graphs on the canvas. The advantage is that insight into related information can be provided in a simple manner and a dynamic analyses can be created at the same time. This can be extended to a table in which the raw data can be traced.
During the design of the data, the following page types are available:
- Canvas:this is the default for a Story Report. With this page type it’s possible to place objects freely on the canvas.
- Responsive:allows for creation of lanes to divide page content into groups. Tiles within a lane automatically stick together when the page size is changed.
- Grid:with this manual data can be added or tables can be created based on the current dta model, which then can be used within the Canvas reporting/Responsive reporting.
Templates
SAP supplies more than 30 templates which can serve as a basis for your own reports. Keep in mind that the data definitions most likely do not match the definitions (models) from your own environment. These will therefore have to be adjusted.
Via the following selection, the various templates can be viewed and possibly imported.
[Report center -> Import -> Content Store]
Limitations
As with any new product, there are several gaps and limitations within People Analytics. At the time of writing, these are the main limitations:
- A story cannot be executed in proxy mode;
- Objects with custom fields defined as Generic object or Foundation object are not supported;
- Recruiting Marketing, Recruiting Posting, Learning and Onboarding 1.0 schematics are not supported. Onboarding 2.0 is supported!
The current status can be found: Limitations and Important Notes for Stories in People Analytics
This blog is part of a series in which the impact of People Analytics and how the tooling can be used is explained. In the next part of the series we will dive deeper into the terms and prerequisites to implement People Analytics within SuccessFactors.


